DIN ISO standard 9002 requires substantiation that soldering systems are operated under controlled conditions where production equipment planning is concerned. Process capability analyses (cpk) must be performed in order to provide this substantiation. Within the scheme of quality assurance management, manufacturers of assemblies are thus obliged to assume more responsibility for the use of measuring methods and instruments, capable of providing statistical values and capability co-efficients for the reflow process.
Dr. Hans Bell, Technology Consultant Rehm, Germany
Specialist for reflow technology is familiar with the time and effort that must be spent in the preparation of a suitable temperature measuring board. Test boards are usually fabricated with components used in actual assemblies, and which are attached to thermocouples. Boards of this type have a very short service life and cannot be calibrated. Beyond this, the thermal characteristics of these test boards are greatly influenced by the design of the assembly, and are not suitable for acquiring the thermal parameters of reflow soldering systems.
The Rehm professional temperature profiler (PTP) is designed to perform as a standardized measuring device for the simulation of thermal characteristics of electronic assemblies, and for the acquisition of numerous thermal parameters for reflow systems and their profiles. Additionally, it can be calibrated as required. Within the framework of a quality management system, the PTP is suitable for monitoring the reflow process itself. The sensor concept allows for standardized measurement and optimization of reflow temperature profiles – independent of the type of reflow oven. Measurements represent random samples which result from process ca-pability analyses. The features are thefollowing:
• Standardized, calibrated measuring device for process qualification
• Board made of aging-resistant fiberglass laminate with high thermal load capacity
• Individually configurable boards with various widths
• Simulation of thermal characteristics of assemblies
• Standardized measurement and optimization of temperature profiles
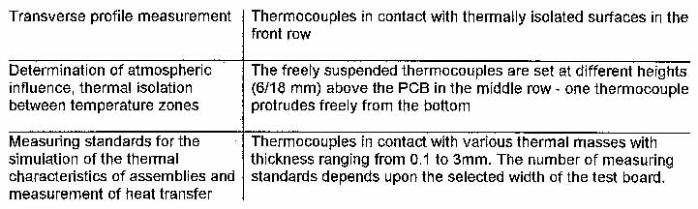
• Measurement of thermal parameters within the system (transverse profile, atmospheric characteristics, temperature zone isolation, heat transfer)
Range of applications
The application capabilities offered by the temperature profiler are many. The PTP has been designed for a variety of applications and tasks in the field of reflow technology:
• Measurement, monitoring and creation of temperature profiles for reflow and curing systems
– Temperature profile optimization
– Comparison of temperature profiles for identical assemblies in different reflow systems
– Simulation of the thermal characteristics of assemblies
• Comparison of reflow systems of identical or different design
• Measurement of performance and tolerance limits for reflow ovens
– Monitoring of thermal parameters in machines
– Evaluation of thermal isolation between temperature zones
– Measurement of transverse profiles in machines
– Measurement of atmospheric characteristics
– Temperature within the oven atmosphere
Examination of temperature profiles
One of the most important tasks of the QA system involves periodic measurement and evaluation of temperature profiles within the reflow oven. System parame-ters are held constant to this end, anddeviations from the given target profileare measured with a test board. These measurements only produce usable results if the board does not undergo changeduring its service life. Actual components on FR4 substrate do not fulfill this pre-requisite.
The wide variety of assemblies which consist of a multitude of different materials and components results in widely varying thermal characteristics during a single run through the reflow oven. Additionally, individual oven design and the method of heat transfer may vary widely as well. It is thus no wonder that temperature curves from different assemblies recorded at the same oven vary greatly from one another. For the same reason, the curves for identical assemblies that have been recorded in different ovens deviate from each other as well.
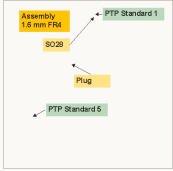
The PTP provides the ability to bring together the characteristics of all assemblies onto a single test board. The only step needed is to assign each of the assemblies to one of the measuring standards on the PTP. Due to the various physical mechanisms which influence heat transfer, these one-time only assignments cannot be replaced with a forecast, as this would not be sufficiently accurate. The measuring standards used for the simulation of components via the PTP can be calibrated, and are unchanging.
Assigning standards to assemblies
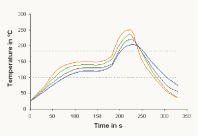
If no experience has been gained to date in the performance of measurements with the PTP, temperature curves for the measuring standards must first be recorded. First, select the oven settings, one after the other, to this end (reflow parameters), and record the temperature curves for the individual standards with the PTP. This results in a group of curves for each oven setting (figure 1).
The second step involves the performance of temperature curve measurements for assemblies using the same oven settings. At least two thermocouples must be attached to the subassembly to this end, one to the largest and one to the smallest mass (component). The results include at least two curves which represent the maximum and the minimum temperature profile for an assembly for the duration of dwell time within the oven. If the largest and the smallest mass included on the assembly are unknown, these can be determined with a simple method.
With fixed oven temperature settings, change the conveyor speed each time the assembly runs through the oven. Start with a high conveyor speed at which no solder joints (paste deposits) will melt. If the conveyor speed is now reduced stepwise, more and more solder joints will gradually begin to melt. The solder joint that melts at the highest speed has the smallest mass, and the solder joint which does not melt until the slowest speed is reached, has the highest thermal mass of all components within the subassembly. The operator is often able to make this proof based upon experience.
In the third step, the temperature profiles of the assemblies (determined in step 2) are compared with the temperature curve groups for the PTP (determined in step 1), which have been recorded with identical oven settings, see figure 2.
Assignment has been successfully completed when almost identical curves have been achieved for the measuring standards and the respective assemblies. What does ”almost identical” mean in this context? Well, allowable deviation between the curves should be defined before measurements are performed (e.g. 65K). On one hand, oven temperature tolerances must be taken into account (e.g. max. 62.5K). On the other hand, the assembly reveals intrinsic temperature differences from one component (thermal mass) to the next (e.g. ±8K). These conditions must be dealt with when curves are evaluated.
It is advisable to envelope each of the subassembly temperature curves within two standard curves. These correspond to upper and lower limit values. The maximum and minimum temperature curves for an assembly are enveloped by two measuring standard temperature profiles in figure 2. Then, the PTP can be used for all further measurements such as production monitoring or the evaluation of ovens.
Comparing reflow soldering ovens
It is often difficult to find objective evaluation criteria when comparing reflow soldering systems. This is due, on one hand, to greatly varying designs which become apparent when observed in detail, and, on the other hand, to the varying conditions under which evaluation and on-site measurements are conducted. Temperature profiles only allow for objective evaluation results in a superficial way. The ability to compare temperature profiles is limited by the selection of the ”right” test board, by proper connection and securing of thermocouples, and by always using the same measuring procedure. In addition to this, the selected parameters for the reflow oven may not allow for any comparison of the measured temperature profiles at all. The test board must always be set-up to reflect the real operating conditions of an assembly, and it must merge standardized measuring criteria. The following basic differences must be emphasized in this respect:
• If the reflow oven is used only to manufacture a single assembly, then it is useful to simulate the real conditions as far as possible (heat transfer, heat conductivity, etc.). The various measuring standards which have been integrated onto the PTP fulfill this requirement.
• If, on the other hand, the reflow oven is used in a mixed production environment, the test board must cover a cross-section of the thermal and gravimetric characteristics of the components. Measuring standards can be selected in a customized fashion with the PTP.
• If the user needs to compare different reflow ovens from more than one manufacturer, the test board should be capable of determining the performance and tolerance limits of the soldering systems. A number of PTP arrays supports this requirement, for example for the determination of transverse profiles and atmospheric characteristics.
• If reflow ovens need to be broken in within different SMT lines (or at diverse manufacturing sites) for the assembly of the same product, identical test boards must be used. As a standardized, calibrated test means that the PTP is well suited for comparative measurements.
Layout of the temperature profiler
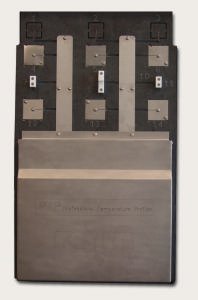
The PTP is shown in figure 3. It is available in three standard widths, including 400, 300 and 215mm. The profiler features various thermocouple arrays for different measuring tasks.
All thermocouple leads are combined into a plug connector, and each measuring point is etched with an ID number. The temperature measuring instrument can be placed inside the box on the PTP, and it has to be designed for Ni-CrNi thermocouples. Not all thermocouples can be used for each of these tests. Only those thermocouples required for the current measuring task should be selected.
Transverse profile of a reflow oven
Most reflow ovens include a conveyor system with adjustable width, and temperature zones which extend over the maximum width of the conveyor system. If the design of the oven gives rise to a temperature difference, this of course affects the assemblies. This temperature difference can only be compensated by heat conductivity within the assembly, which is usually insufficient. For this reason, knowledge of the transverse profile is of special significance for the optimization of reflow profiles.
At least three of the measuring arrays in the front row of the PTP should be used for the determination of the transverse profile of a reflow oven. Good ovens have a transverse profile temperature difference of less than 62.5K.
Atmospheric characteristics in an oven
The stability of the atmospheric temperature within a convection oven has a sig-nificant influence on thermal transfer, as well as the resulting temperature profile. Good reflow ovens show a tolerance of less than 62.5K of the target value. The freely exposed thermocouples in the middle of the PTP are used for this measurement.
These thermocouples can also be used for measuring thermal isolation between the individual temperature zones within the oven. What does thermal isolation mean? Most reflow ovens feature several temperature zones which are adjusted and controlled independently. This allows for the implementation of different temperature profiles within a single system. This is achieved by selecting different temperature values for each of the zones, and by varying the conveyor speed at which the assemblies are transported. However, results are only satisfactory if the profile can actually be influenced by selecting different temperatures for the different zones. Good thermal isolation is defined as minimal reciprocal influence amongst neighboring temperature zones. A zone set to a higher temperature gives warmth off to neighboring zones. If thermal isolation from neighboring temperature zones and control response within the zones are in-adequate, this undesired heat transfer results in increased temperature in adjacent sections.
Determining heat transfer characteristics
Qualitative results regarding the efficiency of heat transfer can be obtained with the PTP, if several measuring standards are used in addition to the freely exposed thermocouples used for measuring atmospheric characteristics. If the temperature curves obtained with the freely exposed thermocouples are compared with those from the measuring standards, the resulting temperature difference serves as an indicator for heat transfer efficiency with constant oven settings. Expertise regarding heat transfer efficiency is especially important for the comparison of different reflow systems.
rehm-anlagenbau.de
EPP 168
Zusammenfassung
Für das Löten von Baugruppen ist die Aufnahme von Temperaturprofilen unverzichtbar. Dabei läuft ein Meßwertaufnehmer/Testboard zusammen mit der Baugruppe durch den Ofen. Mit den solcherart gewonnen Daten lassen sich statistische Prozeßparameter gewinnnen, zudem können mit dieser Methode auch unterschiedliche Öfen oder Temperaturprofile effizient verifiziert werden.
Résumé
L’enregistrement de courbes de température est indispensable pour le brasage des cartes. Un capteur de mesure/carte test passe dans le four avec la carte. Les données ainsi obtenues permettent de réunir des paramètres statistiques du processus. En outre, cette méthode permettrait d’utiliser efficacement différents fours ou profils de température contrôlés.
Sommario
Per la saldatura a dolce di gruppi costruttivi é indispensabile registrare profili di temperatura. Ciò avviene facendo passare nel forno, insieme al gruppo costruttivo, anche un rilevatore di misura/scheda di prova. Con i dati così evinti é possibile ottenere parametri statistici di processo; con tale metodo é inoltre anche possibile verificare in maniera efficiente differenti forni o differenti profili di temperatura.
Unsere Webinar-Empfehlung
.png)
Auch dieses Jahr präsentiert Koh Young wieder aktuelle Trends und „State of the Art“ Technologie aus der optischen Inspektion und 3D-Messung auf der Productronica in München. Aber wir alle kennen das Problem voller Terminkalender, Reisebeschränkungen oder fehlender Zeit, um in…
Teilen:


